TOP Description
Linux top command and is one of the most used and useful utility for real-time monitoring in daily system administrative jobs . top command displays processor activities, real time task managed by kernel ,processor and memory usages, running processes... etc. It displays an interactive interface for manipulating processes and it can sort the tasks by CPU usage, memory usage and runtime. Most features can either be selected by an interactive command or by command line operations which I'm going to describe in detail .Top is a part of the procps package, a set of Linux utilities that provide system information. Besides top, procps also includes free, vmstat, ps, and many other tools. So using top is like using ps, free, and uptime at the same time.
See below for more information
Fields Description in TOP

Top displays variety of details as shown in above
image. I am going to describe each filed for your convenience.
Uptime

- First highlighted field indicates the System current time (hour:minute:second), system uptime (hour:minute), number of active users using the system at the moment and three process load averages.
- Number of active user counts the number of pseudo terminals spawned under certain user ID privileges.It is not the number of currently logged-in users. Let's say you login into GNOME as "ravi" and then you spawn two xterm windows, then it counts you as three users. Top increments the number by one to account the existence of init process.
- The load averages are the average number of process ready to run during the last 1, 5 and 15 minutes. The uptime display may be toggled by the interactive l command.
- You can filter this fields using uptime command as well.
Processes
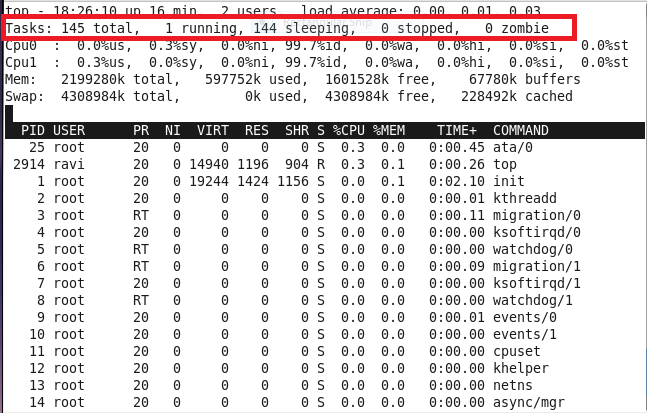
The total number of processes running at the time of the last update. This is also broken down into the number of tasks which are running, sleeping, stopped, or undead. The processes and states display may be toggled by the t interactive command.
Various processor states describes below:
- Running: this represents the number of tasks in a runnable state.
- Sleeping: processes being blocked due to waiting for an event (e.g., time out or I/O completion). It accounts for both interruptible (can be awaken earlier by SysV signal) or uninterruptible (completely ignoring SysV signal) processes.
- Stopped: the exact meaning here is "paused," not "terminated." In a terminal, you can stop a program by sending it a SIGSTOP signal or pressing Ctrl-Z if it's a foreground task.
- Zombie: "Zombie process is like a dead body without soul" . After a child task is terminated, it is cleaned up and the only thing left is a task descriptor that includes a very important value: exit status. So if the number of zombies is high, that is a sign that one or more programs have a bug properly terminating child tasks.
CPU states

Shows the percentage of CPU time in user mode, system mode, niced tasks, iowait and idle. (Niced tasks are only those whose nice value is positive.) Time spent in niced tasks will also be counted in system and user time, so the total will be more than 100%. The processes and states display may be toggled by the t interactive command.
%us and %sy, represent percentage of CPU time spent in user mode and kernel mode, respectively.
Memory Statistic

Command-Line Options
-n
|
Number of iterations. Update the
display this number of times and then exit,Iteration are equal to the number
of updates.
top –n <iteration>
|
-d
|
top displays a variety of information
about the processor state. The display is updated every 3 seconds by default
Specifies the delay between screen updates. You can change this with the s
interactive command.
top –d <time in second>
Ex : top –d 1 (update every 1 second)
|
-p
|
Monitor only processes with given
process id. This flag can be given up to twenty times. This option is neither
available interactively nor can it be put into the configuration file.
top –p <pid>
|
-S
|
Specifies cumulative mode, where each process is listed with the CPU
time that it as well as its dead children has spent. This is like the
-S flag to ps(1).
See the discussion below of the S interactive command.
|
-s
|
Tells top to run in secure mode. This disables the potentially
dangerous of the interactive commands (see below). A secure top is a nifty
thing to leave running on a spare terminal.
|
-i
|
Start top ignoring any idle or zombie processes. See the interactive
command i below.
|
-C
|
display total CPU states instead of individual CPUs. This option only
affects SMP systems
|
-c
|
display command line instead of the command name only. The default behavior
has been changed as this seems to be more useful.
|
-H
|
Show all threads.
|
-b
|
Batch mode. Useful for sending output from top to other programs or
to a file useful when using at or cron. In this mode, top will not accept command line input. It runs
until it produces the number of iterations requested with the -n option or
until killed. Output is plain text suitable for display on a dumb terminal.
|
Interactive Commands
Several single-key commands are recognized while top is running. Some are disabled if the s option has been given on the command line
q
|
Quit
from top
|
space
|
Immediately
updates the display.
|
h
or ?
|
Displays
a help screen giving a brief summary of commands, and the status of secure
and cumulative modes.
|
k
|
Kill
a process. You will be prompted for the PID of the task, and the signal to
send to it. For a normal kill, send signal 15. For a sure, but rather abrupt,
kill, send signal 9. The default signal, as with kill(1), is 15, SIGTERM. This command is
not available in secure mode
|
i
|
Ignore
idle and zombie processes. This is a toggle switch
|
l
|
Toggle
between Solaris (CPU percentage divided by total number of CPUs) and Irix
(CPU percentage calculated solely by amount of time) views. This is a toggle
switch that affects only SMP systems.
|
n
or #
|
Change
the number of processes to show. You will be prompted to enter the number.
This overrides automatic determination of the number of processes to show,
which is based on window size measurement. If 0 is specified, then top will
show as many processes as will fit on the screen; this is the default.
|
r
|
Re-nice
a process. You will be prompted for the PID of the task, and the value to
nice it to. Entering a positve value will cause a process to be niced to
negative values, and lose priority. If root is running top, a negative value
can be entered, causing a process to get a higher than normal priority. The
default renice value is 10. This command is not available in secure mode.
|
s
|
Change
the delay between updates. You will be prompted to enter the delay time, in
seconds, between updates. Fractional values are recognized down to
microseconds. Entering 0 causes continuous updates. The default value is 3
seconds. Note that low values cause nearly unreadably fast displays, and
greatly raise the load. This command is not available in secure mode.
|
f
or F
|
Add
fields to display or remove fields from the display. See The Field and Order
Screens more information.
|
o
or O
|
Change
order of displayed fields. See The Field and Order Screens more information.
|
l
|
toggle
display of load average and uptime information
|
m
|
toggle
display of memory information.
|
t
|
toggle
display of processes and CPU states information
|
c
|
toggle
display of command name or full command line.
|
N
|
sort
tasks by pid (numerically).
|
A
|
sort
tasks by age (newest first).
|
P
|
sort
tasks by CPU usage (default).
|
M
|
sort
tasks by resident memory usage.
|
T
|
sort
tasks by time / cumulative time.
|
The Field and Order Screen
In order to order the display the content of TOP. You can pressing f, F, o or O you will be shown a screen specifying the field order on the top line and short descriptions of the field contents. If the letter in the filed string corresponding to a field is upper case, the field will be displayed. From the order screen you may move a field to the left by pressing the corresponding upper case letter resp. to the right by pressing the lower case one.

References
Linux man page
References
Linux man page
No comments:
Post a Comment